
Date/Time ‘Relative’ Conditions
Sometimes it is handy to display records based on Date/Time values. As an example, you might want to know the number of contracts in the contracts module that will expire within 7 days in your Dashboard?
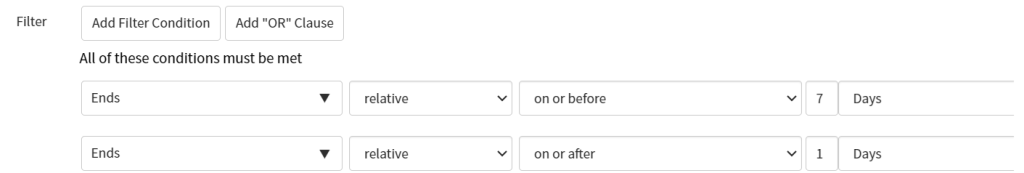
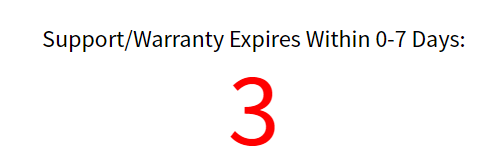
- Create a table Contract [ast_contract] report with ‘Single Score‘ as report type. Let’s call the report: ‘Support/Warranty Expires Within 0-7 Days:‘.
- Add the ‘relative‘ conditions below:
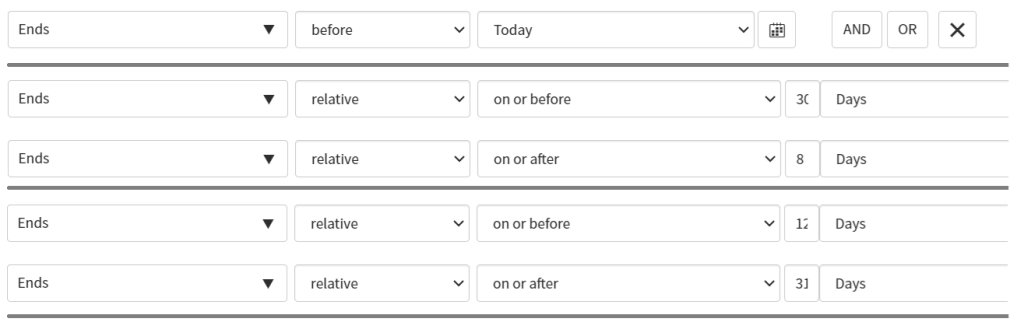
Some other condition exaples:
3. You can now use this report result as a ‘widget’ in your Dashboard:
Interactive Filter
Instead of having loads of different reports with fixed conditions you can create one report and link this to a interactive filter picker. This will save space in your Dashboard as well as give the dashboard user additional flexibility to quickly manipulate the report output.
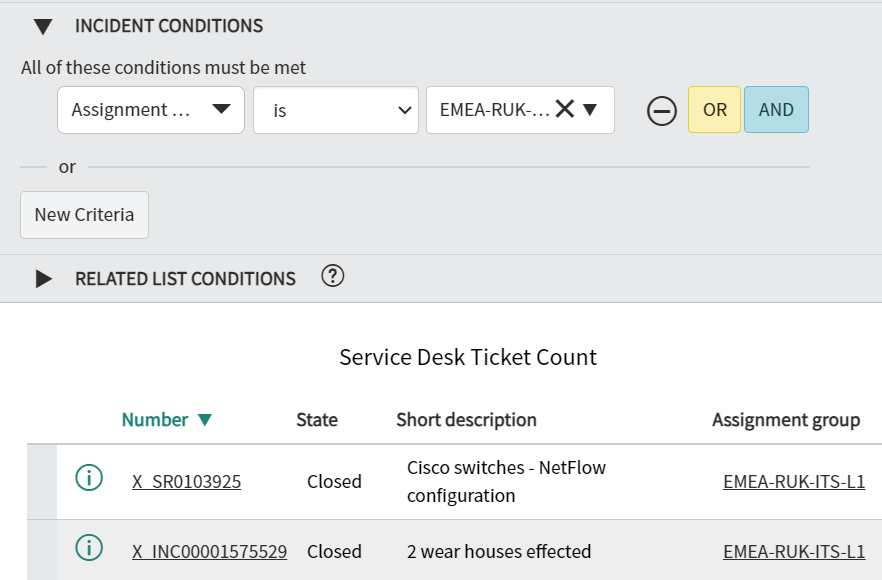
- Let’s start with creating a standard ‘List’ incident report that we later can create a ‘dynamic filter’ for. Let’s call it ‘Service Desk Ticket Count‘:
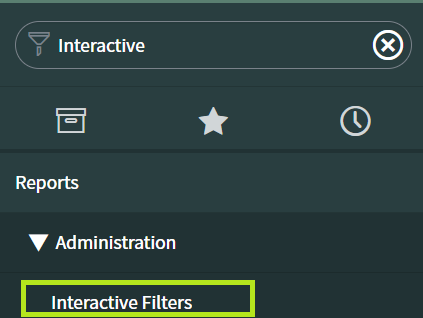
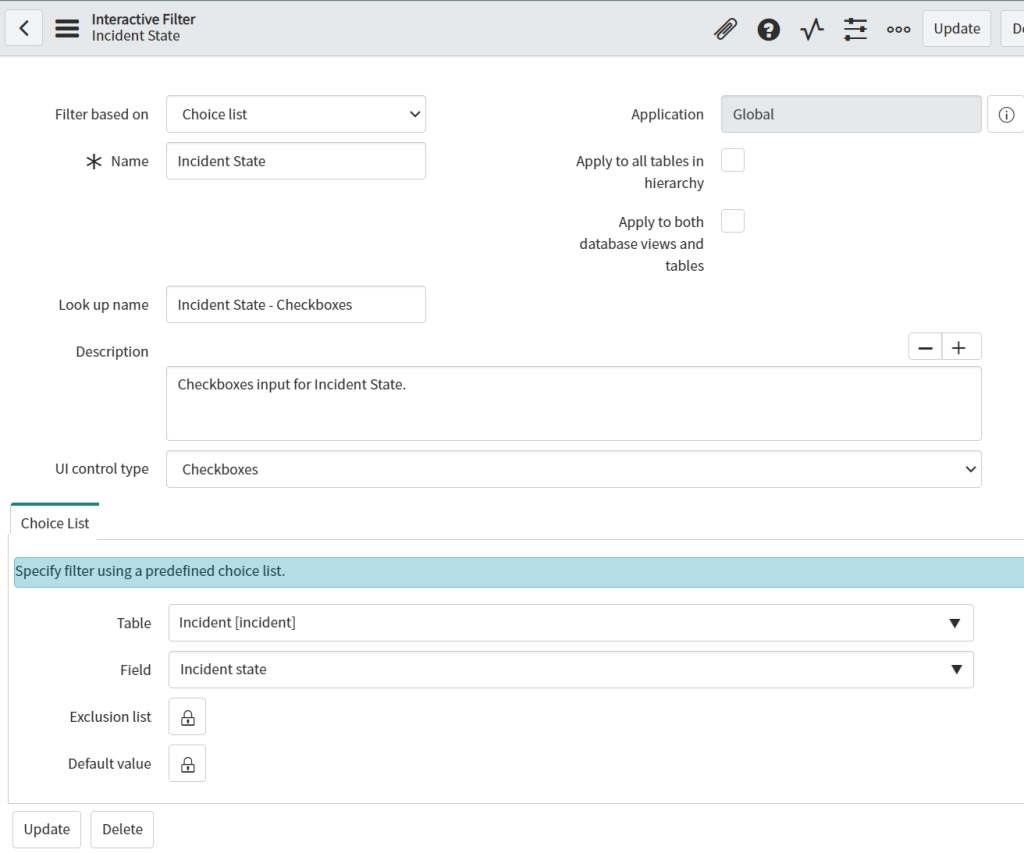
2. Now lets create the ‘Interactive Filter’. Let’s call this one ‘Incident State – Checkboxes‘.
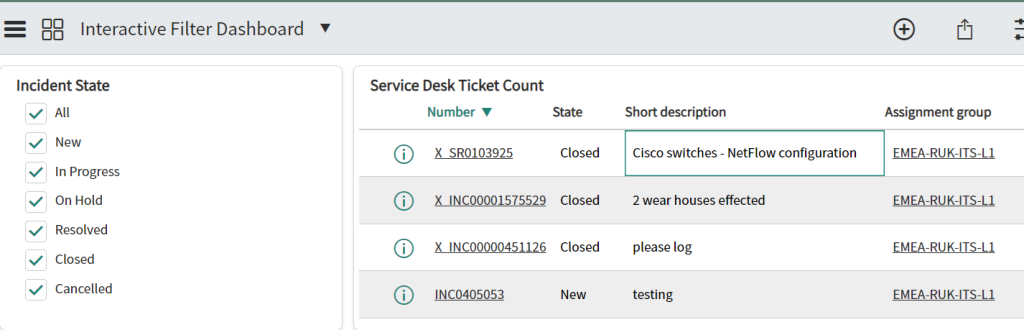
3. Now lets create a Dashboard (assume you know how to do this) add both report [Add Widgets -> Reports -> Service Desk Ticket Count] and interactive [Add Widgets -> Interactive Filter -> Choice List -> Incident State – Checkboxes] filter to Dashboard and link them together.
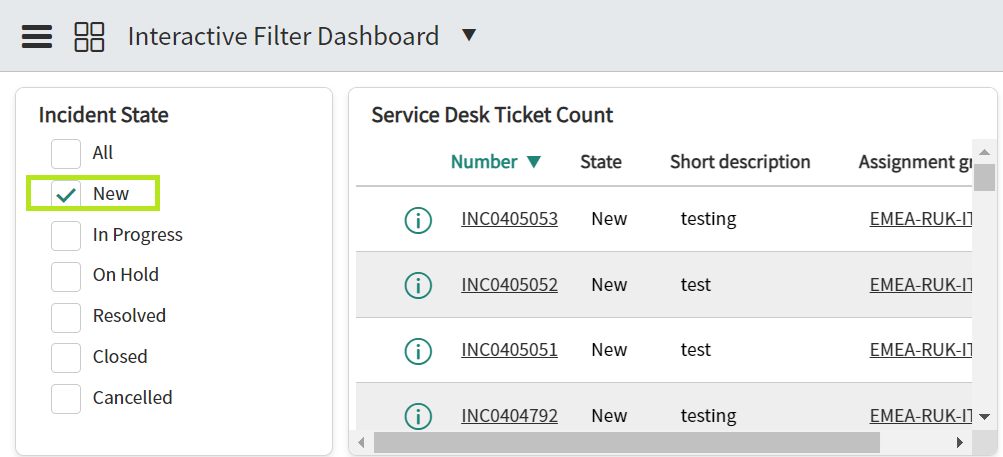
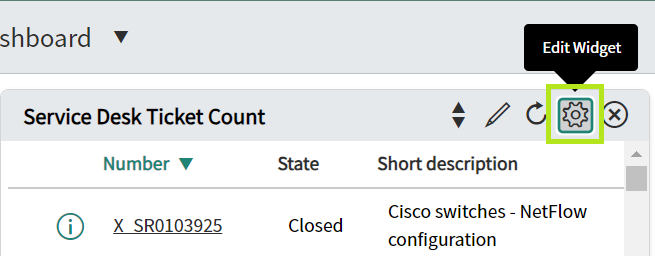
Below show report and Interactive Filter added to dashboard:
Now link the report to the Interactive Filter:
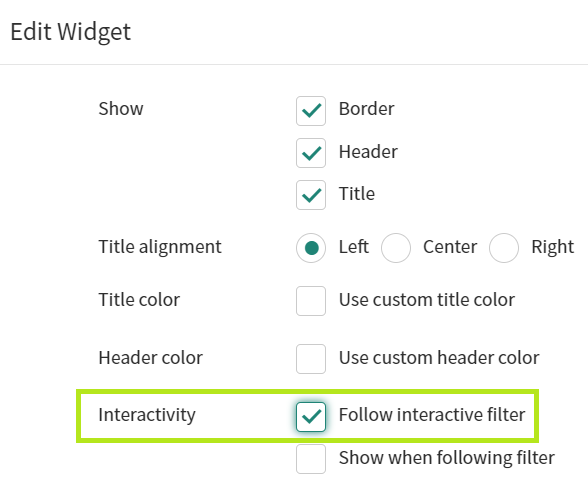
Now you can see the result, when you change the Interactive Filter the report will dynamically update against input: